Matplotlib Examples
Revision as of 14:13, 12 September 2008 by PeterHarding (talk | contribs)
Generating Matplotlib Examples
Makefile
#---------------------------------------------------------------------

GUI_TESTS = \
        anim.png \

PNG     = \
        anscombe.png \
        alignment_test.png \
        arctest.png \
        axprops_demo.png \
        barchart_demo.png \
        bar_stacked.png \
        box1.png \
        dashticklabel.png \
        dashpointlabel.png \
        date_demo_rrule.png \
        legend_scatter.png \
        polar_scatter.png \
        step_demo.png \
        text_handles.png \
        to_numeric.png \
        transoffset.png \
        two_scales.png \
        stock_demo.png \
        vertical_ticklabels.png \
        zorder_demo.png \

TESTS   = \
        anscombe.py \
        alignment_test.py \
        arctest.py \
        axes_props.py \
        barchart_demo.py \
        bar_stacked.py \
        boxplot_demo.py \
        dashtick.py \
        dashpointlabel.py \
        date_demo_rrule.py \
        legend_scatter.py \
        polar_scatter.py \
        step_demo.py \
        text_handles.py \
        to_numeric.py \
        transoffset.py \
        two_scales.py \
        stock_demo.py \
        vertical_ticklabels.py \
        zorder_demo.py \

#---------------------------------------------------------------------

all:    $(PNG)

test:   arctest.png

dist:
        tar cvfz matplot_demos.tz Makefile $(TESTS) $(PNG)

#---------------------------------------------------------------------

anim.png:
        python ./anim.py

anscombe.png:
        python ./anscombe.py

alignment_test.png:
        python ./alignment_test.py

arctest.png:
        python ./arctest.py

axprops_demo.png:
        python ./axes_props.py

barchart_demo.png:
        python ./barchart_demo.py

bar_stacked.png:
        python ./bar_stacked.py

box1.png:
        python ./boxplot_demo.py

dashpointlabel.png:
        python ./dashpointlabel.py

dashticklabel.png:
        python ./dashtick.py

date_demo_rrule.png:
        python ./date_demo_rrule.py

polar_scatter.png:
        -python ./polar_scatter.py

step_demo.png:
        -python ./step_demo.py

text_handles.png:
        -python ./text_handles.py

to_numeric.png:
        -python ./to_numeric.py

transoffset.png:
        python ./transoffset.py

two_scales.png:
        python ./two_scales.py

legend_scatter.png:
        python ./legend_scatter.py

stock_demo.png:
        python ./stock_demo.py

vertical_ticklabels.png:
        python ./vertical_ticklabels.py

zorder_demo.png:
        python ./zorder_demo.py

#---------------------------------------------------------------------
Some Examples
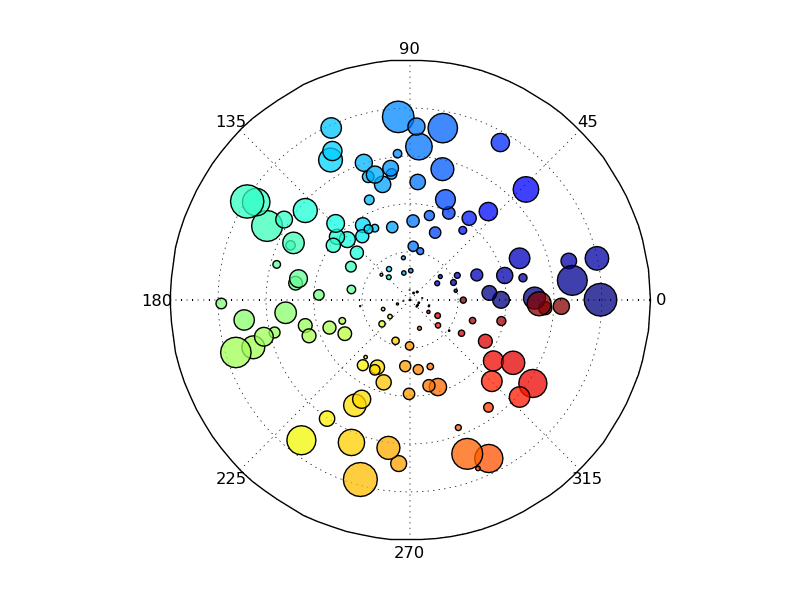
polar_scatter
#!/usr/bin/env python
from pylab import *

N      = 150
r      = 2*rand(N)
theta  = 2*pi*rand(N)
area   = 200*r**2*rand(N)
colors = theta
ax     = subplot(111, polar=True)
c      = scatter(theta, r, c=colors, s=area)

c.set_alpha(0.75)

savefig('polar_scatter')
